Gallery
Here, I try to collect scripts from exploring with various graphs and data visualization methods. The coding style might differ from one graph to another depending on how I explored with new features, packages, etc., or on how I forgot to use them … To access a script, simply click on the desired thumbnail.
Maps
 |
 |
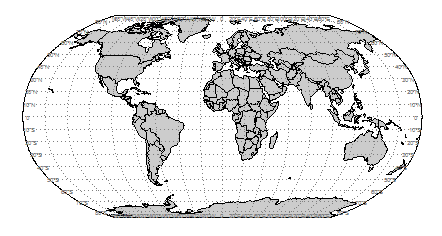 |
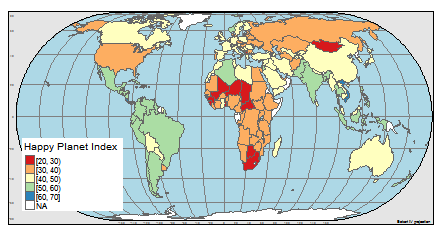
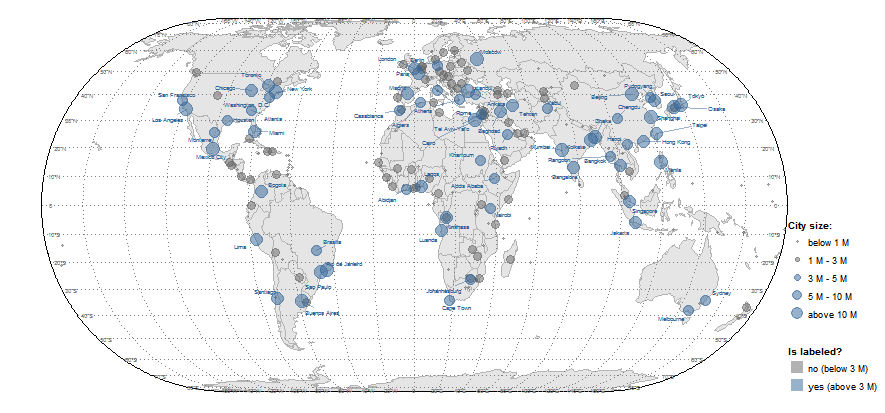
| tmap package: choropleth map | ggplot2 & ggrepel: Eckert IV proj. | ggplot2: Robinson projection |
 |
 meridian.png) |
|
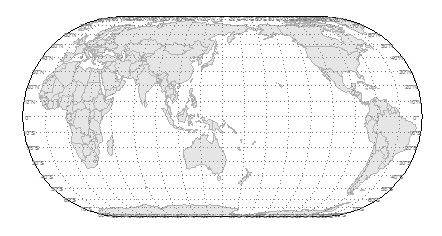
| ggplot2: Pacific centered world map | Shift central (prime) meridian |
Line and dot plots
 |
 |
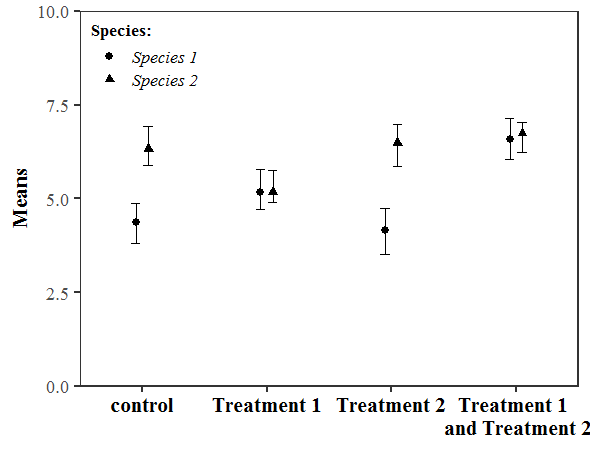 |
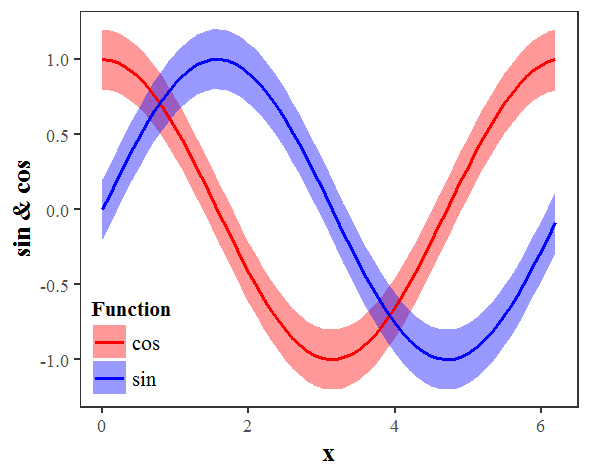
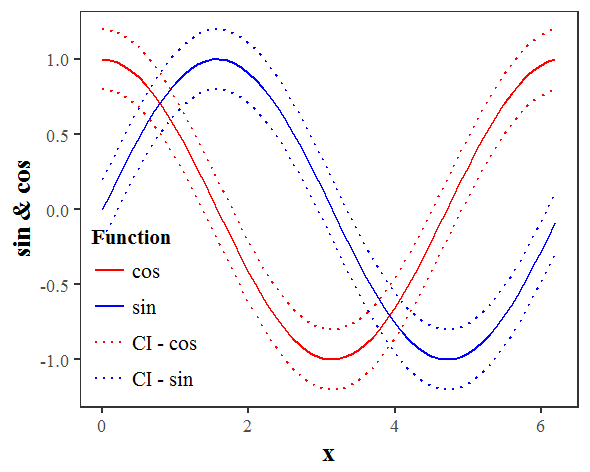
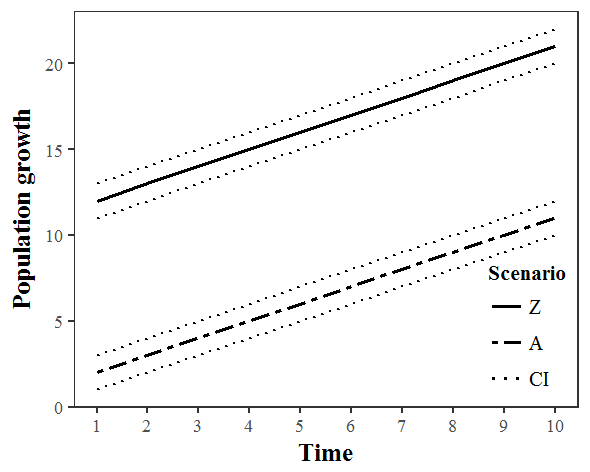
| ggplot2: colored confidence bands | ggplot2: colored confidence bands | ggplot2: dotplot with CIs |
 |
 |
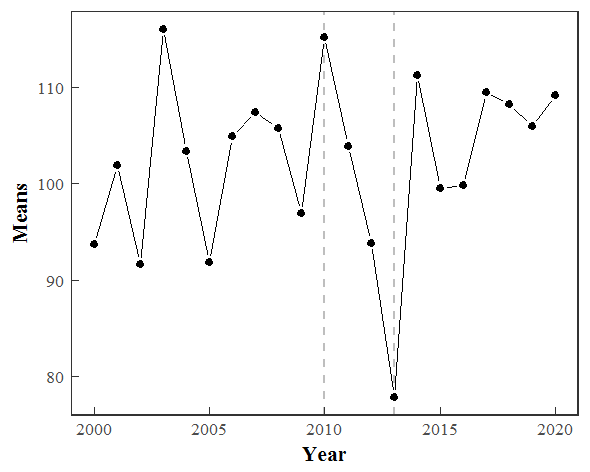 |
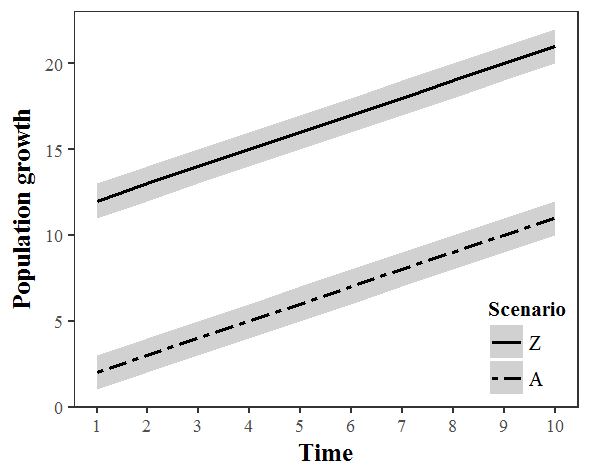
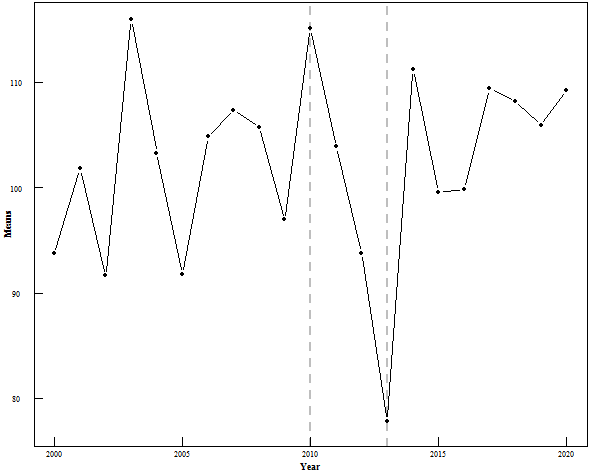
| ggplot2: simple confidence bands | ggplot2: simple confidence lines | ggplot2: lineplot, inwards ticks |
 |
||
| base R: lineplot, inwards ticks |
Barplots
.png) |
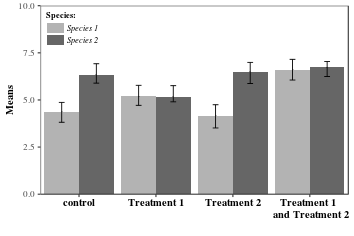 |
| base R | ggplot2 |
Other
 |
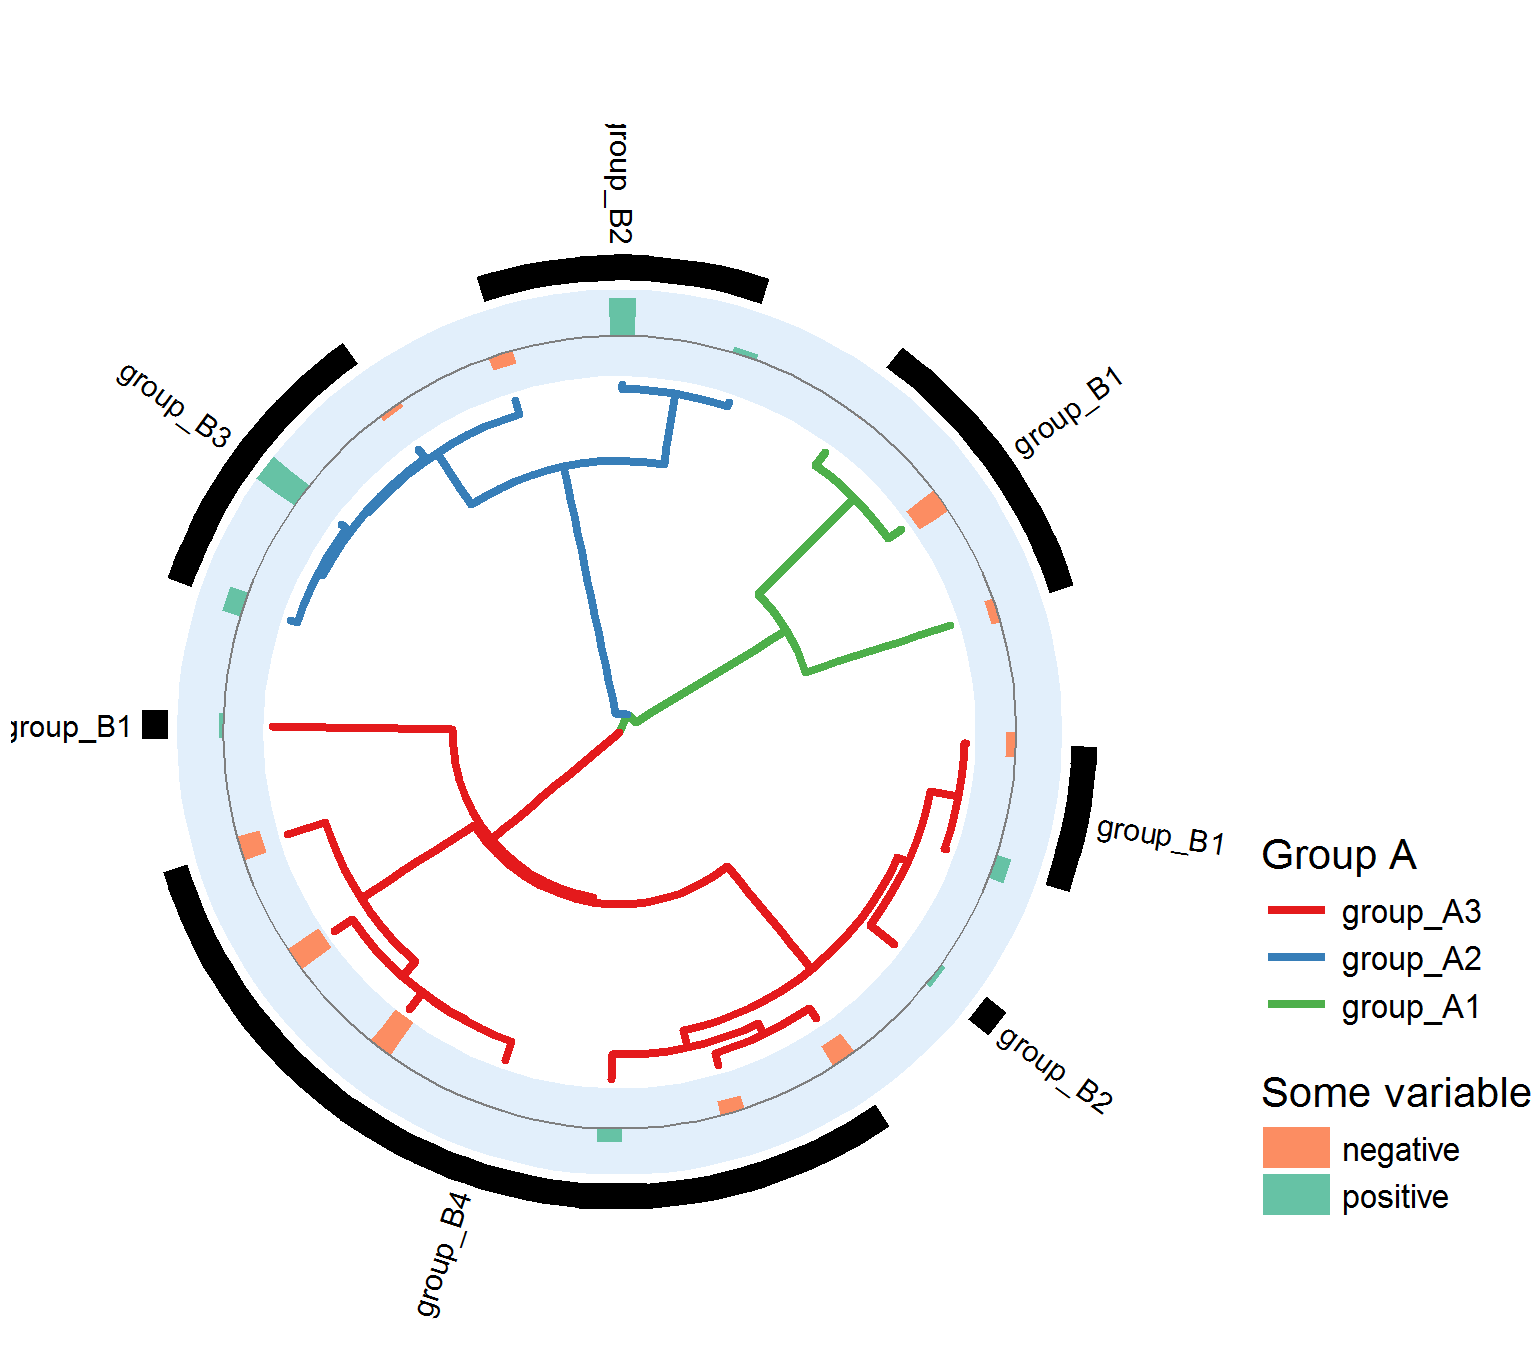 |
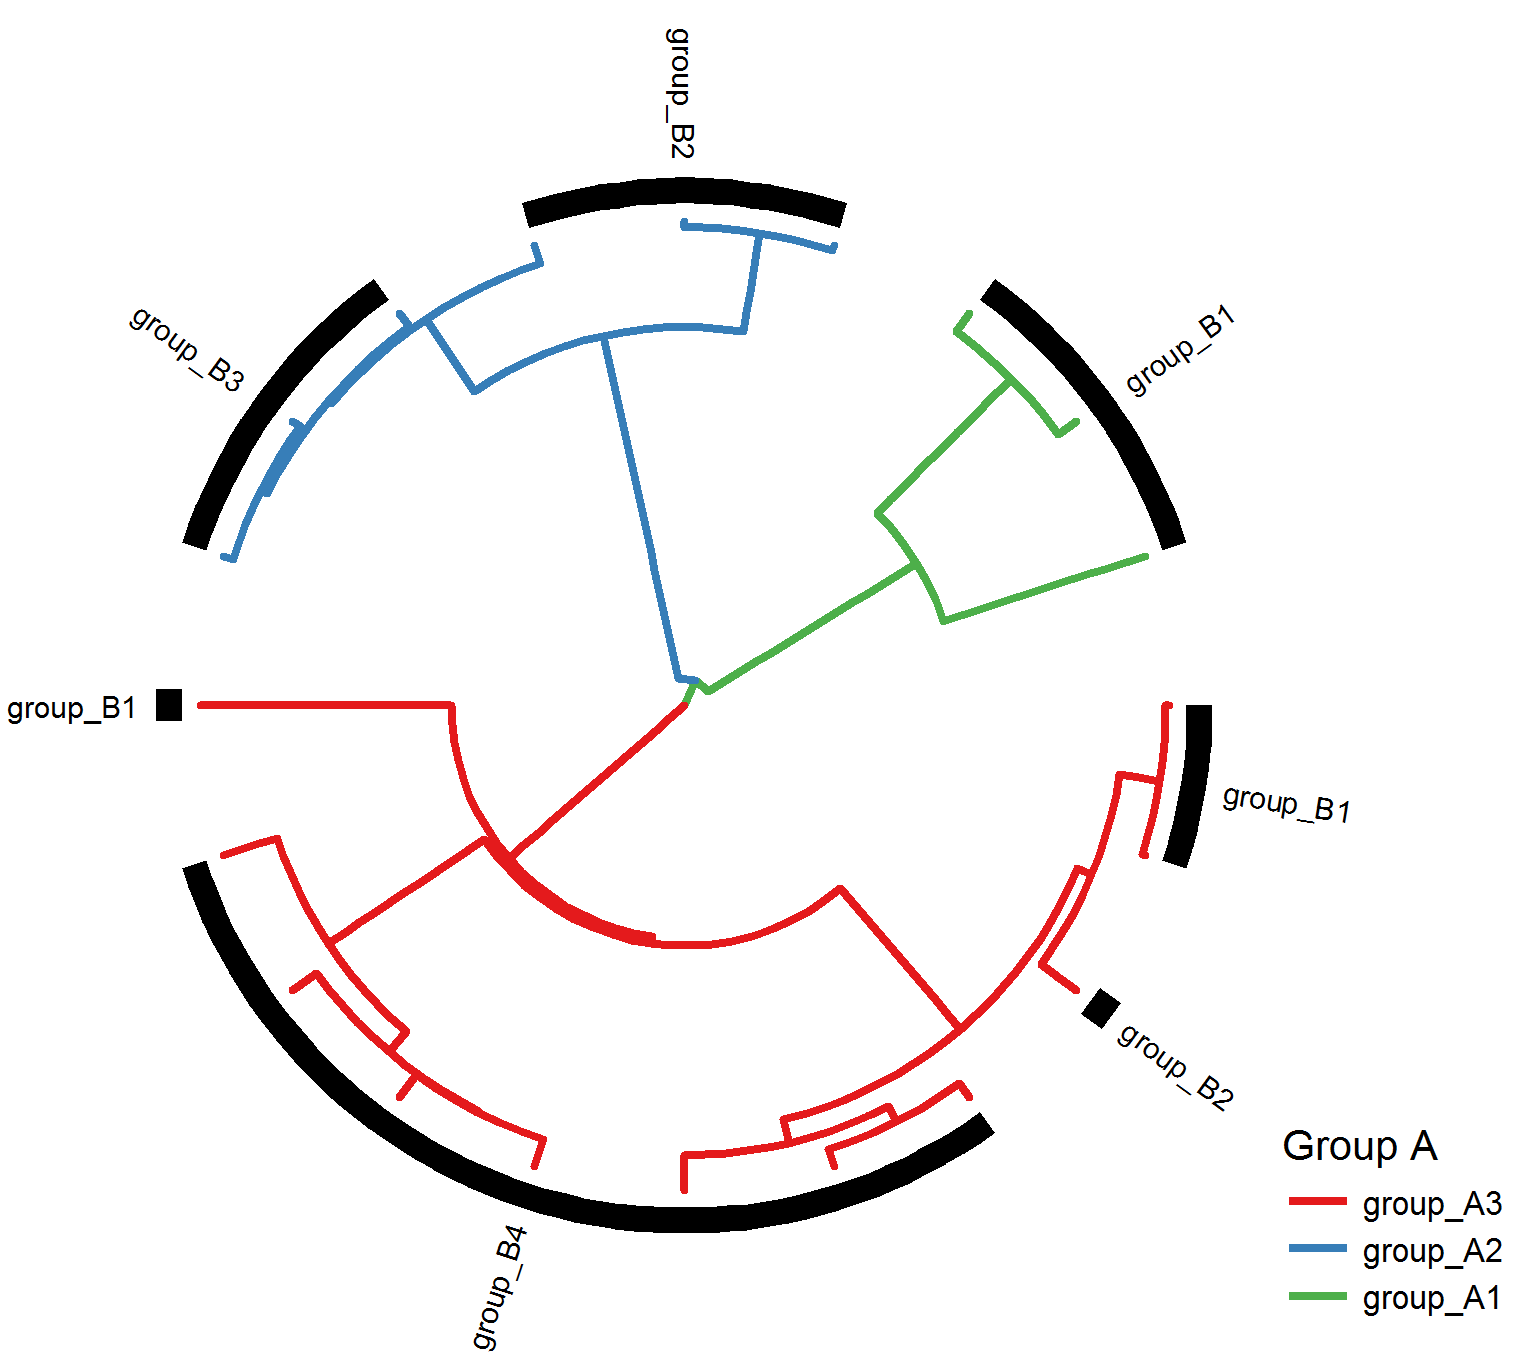
Annotation with ggtree |
Annotation with ggtree |