plotbiomes

Overview
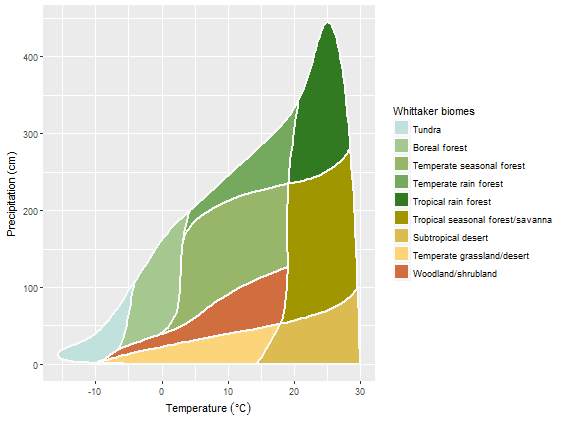
R package for plotting Whittaker’ biomes with ggplot2.
The original graph is Figure 5.5 in Ricklefs, R. E. (2008), The economy of nature. W. H. Freeman and Company. (Chapter 5, Biological Communities, The biome concept). The figure was processed and brought into an R friendly format. Details are given in Whittaker_biomes_dataset.html document.
Plotting Whittaker’ biomes was also addressed in BIOMEplot package by Georges Kunstler and in ggbiome package by Guillem Bagaria, Victor Granda and Georges Kunstler.
Installation
You can install plotbiomes from github with:
# install.packages("devtools")
devtools::install_github("valentinitnelav/plotbiomes")
Examples & Vignettes
Check examples at Whittaker_biomes_examples.html and Check_outliers.html vignettess.
Simple example of plotting Whittaker’ biomes:
library(plotbiomes)

whittaker_base_plot()